Importance of Process Flow Diagrams in Process Engineering 2🏔
- Taliya Mammadhasanzada

- Aug 11, 2020
- 6 min read
Warm greetings to all in the 9th post on #Day8 ! Today, we will continue the topic of Importance of Process Flow Diagrams 2. Here we go 🤩💡,
PFD Differences🤨
📍PFD of a laboratory scale process could be somewhat different from that of plant scale PFD. In laboratory, emphasis is given on safety aspects. Also some utilities could be different from those used on a plant scale. For example, in laboratory use of ice and dry ice are common for achieving required chilling. On a plant scale, chilled water or chilled brine at different temperatures are used. Similarly, once through raw water system is common for cooling in condensers in the laboratory while closed circuit of cooling water is a practice in the industry.
🧪Batch distillation is commonly employed in the laboratory while in plants, batch or continuous distillation columns are employed with specific controls to achieve desired purity of the distilled materials. Process Flow Diagram of a laboratory experimental unit could be simple and different from that of a pilot plant. For example, from Reference 4-
Thodos has described a PFD for the study of reaction kinetics to synthesize ethyl chloride from ethylene and hydrogen chloride gas.
This is a gas phase endothermic catalytic reaction, studied in the pressure range of 8-11.5 bara and temperature range of 150°C– 300°C. A 100 mm steel pipe reactor with electric heating element, wrapped over it, was used.
📌Dry ice trap, following the reactor, removed ethyl chloride while excess HCl was scrubbed in a water trap. Thus a continuous experimental set-up provided useful data for determining reaction rate equation.
📌📌When the above process is to be studied on a pilot plant, the reactor could still be a pipe (bigger in size) with jacket in which thermic fluid (hot oil) circulation is provided. For separation of ethyl chloride, heat exchanger with chilled brine can be considered. Scrubbing of unreacted HCl can be performed in an efficient packed tower or in a falling film absorber.
Example 🔑
💈Figure 4.4 is the PFD for separation of ethane and heavier components from natural gas. In this process also only physical separation takes place but operating conditions of all streams are specified. Flow rates of major streams and their compositions are given in a tabular form at the bottom of the PFD.

🧬An interesting feature of the PFD is incorporation of two heat pumps which will result in substantial energy saving. Also an expander is provided to generate power when gas pressure is reduced. External refrigeration is provided at sufficiently high temperature level so that a standard refrigeration plant can be used and cryogenic liquids are not required. Development of PFD thus provides an opportunity to a process engineer for energy conservation. 🧬Main utility differences:
Steam generation, steam distribution and utilization, cooling water circuit, thermic fluid circuit, instrument/plant air system, nitrogen (inert) gas system, refrigeration system, etc.,
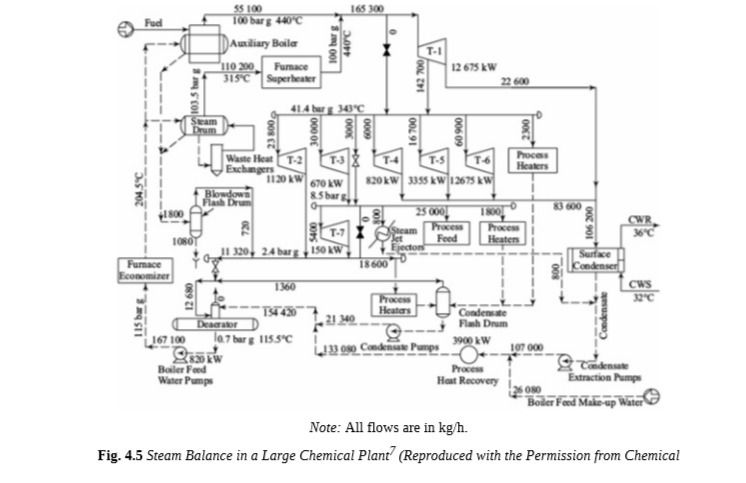
fall under this category. 💈Figure 4.5 is a typical cascade steam balance of a large chemical plant. This is also a PFD of the steam system. Development of an efficient steam system can pay rich dividends in terms of optimum energy input.
Software👨🏻💻
🧹Process flowsheeting can be carried out with the help of a computer. Steady state material and energy balance calculations can be performed on a spreadsheet or with the help of a mathematical software which also can generate block diagrams. Specialized software such as Microsoft Visio, Aspen Plus etc., are available for the preparations of PFDs. References 9 to 11 are useful in developing computerized flow sheets.
Development of Piping and Instrumentation Diagrams🧑🏿🎨
⛓Having understood the requirements of PFD, it is rather easy to understand the requirements of P&ID. Emphasis is changed from process flows to 📌process control. Controls are not possible without measurements of variables; such as pressure, temperature, concentration, etc., for which instruments are required. A diagram incorporating piping, instrumentation and controls is known as P&ID. In simple plants minimum instruments are installed. They are just adequate for manual control. However, it is needless to emphasize that installation of adequate instruments justify the cost in terms of productivity and safety.
🩸Many batch processes are being controlled in manual manner. But as the scale of plant is getting bigger and bigger, role of instrumentation and control (I&C) is becoming important. This I&C hardware not only results in smoother and efficient plan operation but also gives safer operation and high onstream factor. Modern chemical plants incorporate sophisticated I&C, thereby centralized operation from a control room is possible. PLC (Programmable Logic Control) and DCS (Distributed Control System) have become common terminology in I&C. In addition to I&C, P&ID also incorporates other details such as pipeline details, location of valves and fittings, safety valves’ locations, etc.
💡In major chemical engineering projects, piping and fittings are classified to cover specific range of pressure and temperature for each fluid. This classification lists material of construction, thickness, types of fittings required etc., for piping. This classification is mentioned on each pipe symbol on P&ID in addition to the size of the pipe. 🛠Many times, fluid flowing in the pipe is indicated by symbolic letters, e.g., NG for natural gas, S for steam etc. This helps project engineer to specify the piping material with fittings for procurement with ease.
💡💡Apart from instrumentation and control details, many other details are also covered on P&ID. Cold and hot insulations are marked, at times elevation is mentioned when relative height of a specific requirement is important. For example, barometric condenser is installed at 10.5 m height from hot well water level as standart atmospheric pressure equals 10.33 meters of water coloumn. Similarly, when a pump takes suction from a vacuum system, NPSH requirements are to be met which means positive suction is required depending on the vacuum. 🛵Location of sample pointsand their arrangements are also shown on P&ID. Symbolic presentation on the diagram should be easily understood by the engineer. There are standard symbols for such presentation. All engineering companies have their own standard symbols which are supplied along with P&ID.
Symbols for equipment🛠
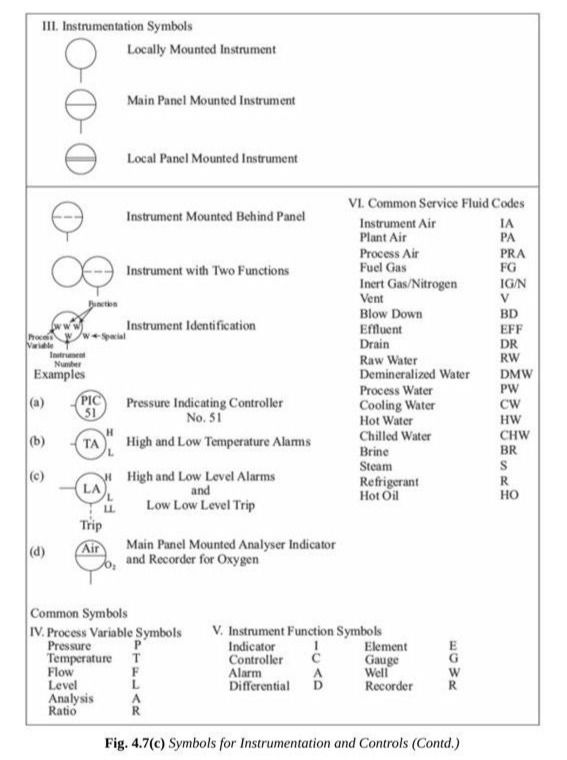
Let’s look at Figure 4.6 and 4.7:
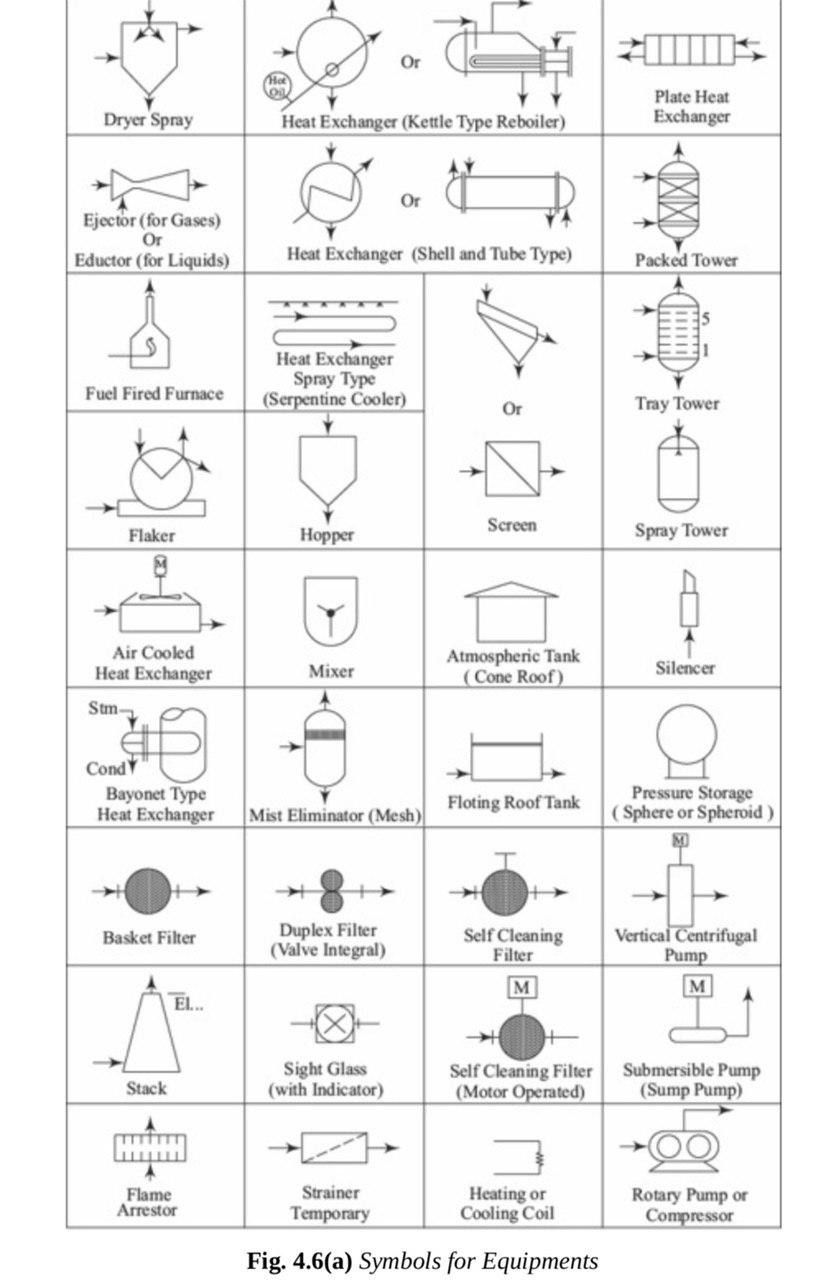
🦼Figure 4.6 b:
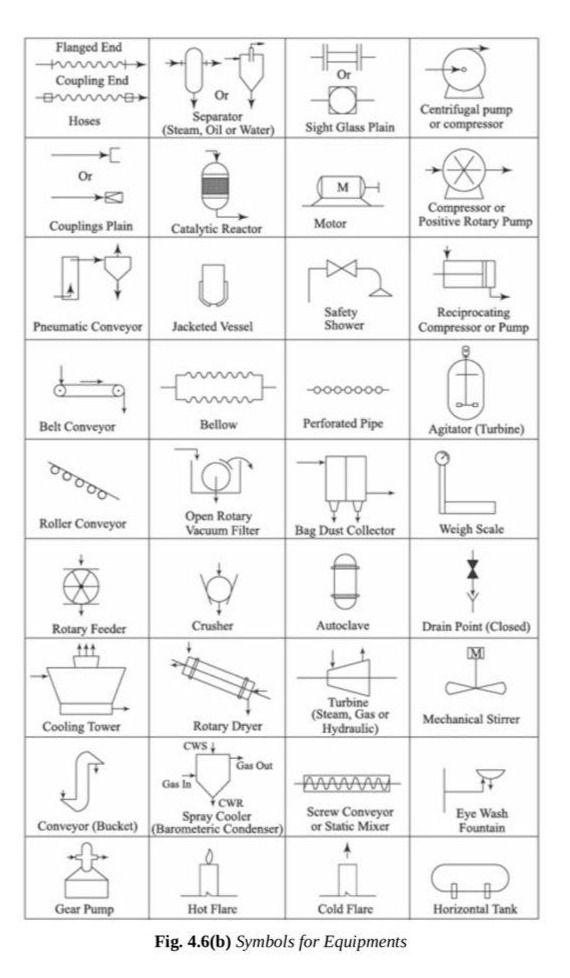
🛴Figure 4.7 a:

🚔Figure 4.7 b:
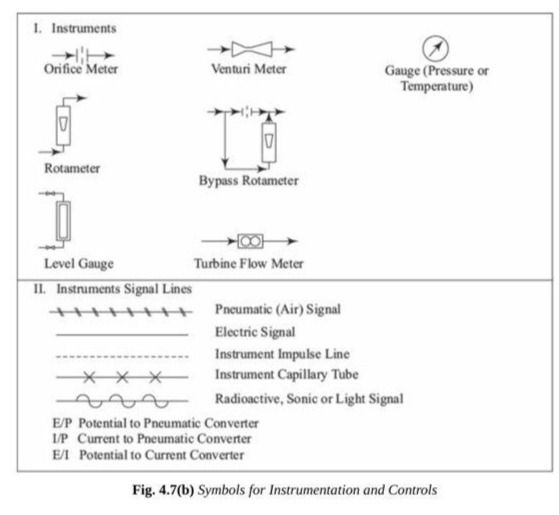
🛺 Figure 4.7 c:
Conclusion🚞
🏖PFD and P&ID are indispensable as transmitters of information, essential in the design stages. They can also be considered as the instruments of communication. In the final analysis, process diagrams communicate an astonishing amount of engineering information about many things to many groups for a variety of uses. It is not surprising that preparations of PFD and P&ID have assumed great importance in chemical process industry. Process engineers can produce innovative designs which can be well presented by these diagrams. Time spent on preparation can easily result in cost savings, efficient plant layout, and safer plant operation.
References 📖
Introduction to Process Engineering and Design pg. 80
Winnick, J., Chem. Engg. Prog. 86 (1), 1990, p. 41.
Thodos, G., and L. F. Stutzman, Ind. Engg. Chem., 50 (3), 1958, p. 413.
Prugh, R. W., Chem. Engg. Prog., 70 (11), 1974, p. 72.
Bhatt, B. I., and S. B. Thakore, Stoichiometry, 5th Ed., McGraw Hill Education, New Delhi, 2010.
Guccione, E., Chem. Engg., 72 (4), 1965, p. 144.
Johnson, J. E., and D. J. Morgan, Chem. Engg., 92 (14). 1985, p. 72.
Liu, YA., B Lucas, and J.Mann, Chem. Engg., 111 (1), Jan. 2004, p.30.
Westerburg, A.W., H. P. Hutchison, R. L. Motard, and P. WiSnter , Process Flowsheeting, Cambridge University Press, UK, 1980.
Turner, J., Chem. Engg. Progr., 88 (8), 1992, p. 59.
Julian, F.M., Chem. Engg.Progr., 81 (9), 1985, p. 35.
Bartow, M., and E. Spark, Chem. Engg., 111 (1), Jan. 2004,p. 49.
Swaraj Paul, Surface Coating; Science & Technology, 2nd Ed., John Wiley & Sons, USA, 1985, p.127.
Additional Resources 🧪🔑
You can get deep insight about Process/Chemical Engineering from these sources😉:
https://t.me/OilAndGas- Information about Oil&Gas (mainly arabic lang)
https://t.me/chemical_worlds- Chemical Engineering Books, Quizzes and GATE Study Group
https://t.me/chemical_environmental- Discussion group related to Chemical Engineering Problems
https://t.me/chemicalengineeringworld_cew- Everything related to Chemical Engineering
https://t.me/ebookgate- Chemical Engineering E-books (Telegram Channel)
https://www.youtube.com/channel/UCqioh32NOJc8P7cPo3jHrbg- Piping Analysis
https://www.youtube.com/channel/UCQfMyugsjrVUWU0v_ZxQs2Q -Mechanics of engineered devices
http://chemicalengineeringguy.com/- suggests a wide range of courses in Chemical engineering (you can find free courses on topic of Aspen HYSYS, Aspen Plus)
https://www.youtube.com/user/LearnEngineeringTeam- suggests working principles of every engineered devices, equipment and etch.
https://www.youtube.com/channel/UCR0EfsRZIwA5TVDaQbTqwEQ- suggests great information about pumps, compressors with animation.
🔌Today we have already started to learn about Importance of Process Engineering Diagrams, Process Flow Diagrams, Piping and Instrumentation Diagrams, examples, main symbols of equipment and etch.
📌Tomorrow we will continue to learn about additional details of PFD, PFD examples, P&I Diagrams and development of P&I Diagrams. Now, time to say goodbye👋🏻 until tomorrow and Stay tuned for more content 😉🌝✨!
✏️Note: If you need one of those books or links, you can contact me via my email or LinkedIn profile.
#process #processengineering #engineering #chemical #chemicalengineering #technical #education #dailypost #newpost #wixsite #day8 #technology #material #materialbalance #mass #massbalance #project #projectengineering #selfdevelopment #challenge #recycle #streams #purge #improvement #fluidflow #flow #fluidmechanics #fluiddynamics #water #waterhammer #contuinity #energy #equations #Pfd #processdiagrams #diagrams #piping #instrumentation #pid #development #examples #study #studentlife


Comments